We all know how to debug classic ASP.NET application using the famous "Attach to Process" tool in our favourite IDE. However, when debugging sharepoint applications, you need to attach to the w3wp.exe thread. You will notice that you may have multiple w3wp.exe thread showing up in your Attach to Process window.
How do you know which process to attach to. One dirty and long way to do is to set a breakpoint, and then attach each process one by one. If the breakpoint is a solid red, then you know that you got the right process. However, this is not the recommended way as there may be other reason why you may get a hollow red breakpoint icon. The symbols may not have been loaded yet, you may have missed a dll or two while GAC'ing between builds, etc.
A better way to pinpoint which w3wp.exe process to attach to, use the following dos command:
%windir%\system32\inetsrv\appcmd.exe list wp
This is what the output would look like on a console:
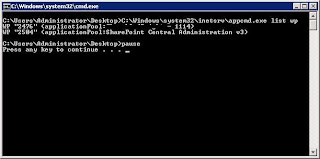
You can even throw this inside a batch file which gets called at the end of the a post-build event.
Note that this is only applicable for servers running IIS7. Previous IIS versions had a different tool called iisapp.vbs which is no longer available with IIS7.
1 comments:
Who knows where to download XRumer 5.0 Palladium?
Help, please. All recommend this program to effectively advertise on the Internet, this is the best program!
Post a Comment